 Getting out of the red with your page speed.
So you are looking to speed up your website and provide that better user experience to your clientele right? Well! With having studied page speed issues in great depth over the years I am going to give you some tips and tricks on some common faults that most people will encounter, where to start, some useful resources and how to overcome these to get your site into the green or maybe even hit that magical 100% goal.
First up if you visit our website we can tell you that we are not at the 100% mark for page speed, the reason being is that we load in a lot of external scripts from providers all around the globe which we cannot manage so do not take our website speed into consideration although it is optimised for optimal performance using all of the techniques below we are still running very fast.
Secondly I will list the faults some of you may be struggling to understand with an explanation of each. I will explain the things to do for each of these and finish up with some neat tricks we have done on our own website to alleviate some more complex problems. It is quite an in depth article but I do hope it can benefit both you, your business and making the web a better place. So here goes!
Problem 1. Optimize images:
This is the first and foremost problem that will slow your website down. There can be many images that are taking a long time to load so you need to tackle this head on. There are two problems that can be causing this so firstly run a google page speed test and download all your images that it lists to a folder on your desktop.
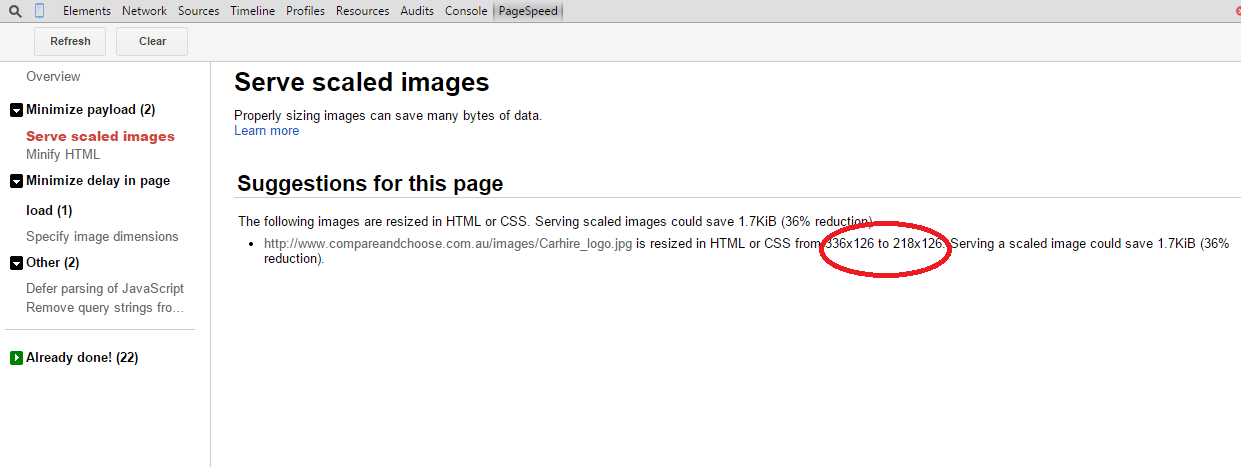
Before you go down the road of compressing them note that they may need resizing because your html or css may be resizing them to the required size before rendering them out to the browser. A great plug in is page speed insights for chrome developer tools. It is a very easy to install plug in, you just type in your url and click analyze. You will see something like this.

What is happening here is that we need to re-size this image to 269×95 pixels before we optimize the image. If we optimize it first then re-size it we will loose compression. The best way I have found to do this is in paint, just open up your image and select the correct size it is asking for.
Ok so by now you have re-sized all your images to the correct pixel size. Now head over to tinypng.com a great resource for compressing the images both png and jpg, every image I have ever used has never lost its look and feel or pixilation and I highly recommend this resource.(if you have a better one then feel free to use your own). You can upload 20 images at a time with tinypng and remember when you download them back to your folder to keep the same image names. We are now at the point of having.
A: all your images re-sized
B: all your images compressed
You can go ahead and upload these now and re-run a google page speed test. If you had many image causing problems you should see a good improvement. If you only had one image causing problems you should have one less problem listed in google page speed results.
PLEASE NOTE: If you are running on mobile responsive devices you may have frames around images and so on that are a different size so these issues will have to be overcome with your mobile development coding. Also please ensure you take a backup of everything before downloading & uploading images or anything else of that nature.
Problem 2. Elimate render-blocking Javascript and CSS in above the fold content.
This can be a big headache and there can be a number of problems which could cause these issues but the goal here is to get the css loaded before the javascript and even better to get the critical css loaded first. So what can you do you may ask. Ok
There are two parts to the css the critical css for the “above the fold content” and none critical css “below the fold content” which means when your css is loading the “above the fold content” it is what the user sees on their screen or device. Below the fold is what they don’t see (maybe a footer section, footer menu or something of that nature) so this is none-critical “below the fold content” that we can defer till later, the idea is to get the user experience as fast as possible to them, by the time they scroll down to the footer the “below the fold content” would have or should have loaded the above the fold content is around 600px in depth. Every website is different in the way your files are loaded but the above mentioned should give you an idea of the workings of things. It is a whole new article on going into depth to rectify all the issues you may have but what you can do is as follows.
A: Asynchronously load your Javascript, some people go for the defer command but to be honest forget this as it is not supported by some browsers and I am not sure on the future support of this command.
The command will be something like this
<script src=”js/yourscript.js” async>
What you are doing here is saying something like “hey mr browser please don’t load my javascript until all my css has loaded, then I am more than happy for you to come back and load it” again note on more responsive developments it maybe a javascript library file that is dependent on rendering some responsive issue such as a scrolling form so you will need to research the issue further and make sure to test,test,test
B: Minify your javascript, this will not stop the blocking of your css but will eliminate problem 6 below.
C: Optimize the delivery of your css, as explained earlier try to deliver the css above and below the fold and try and combine all your css files into one css file. Most of the time you can easily just copy and paste one css file to the bottom of the other and then remove the calls to the old file ( a great resource for further information on this is Patrick Sextons feed the bot )
Problem 3. Leverage Browser Caching
When your website is displayed there are many calls to be made to your images/logo css files, javascript files and so on which all takes up those vital milliseconds with browser caching your web-browser has already loaded these resources so we need to get the browser to remember these from memory without having to make any further external calls to the resources. This is where leverage browser caching becomes available. If you are familiar with htaccess files you can make use of this by specifying the resources you wish to cache and for what period of time.
You will see something like this
<IfModule mod_expires.c>
ExpiresActive On
ExpiresByType image/gif “access plus 1 week”
ExpiresByType image/jpeg “access plus 1 week”
ExpiresByType image/jpg “access plus 1 week”
ExpiresByType image/png “access plus 1 week”
ExpiresByType image/ico “access plus 1 week”
ExpiresByType text/css “access plus 1 week”
ExpiresByType text/javascript “access plus 1 month”
ExpiresByType text/x-javascript “access plus 1 month”
ExpiresByType application/x-javascript “access plus 1 week”
ExpiresDefault “access 1 day”
</IfModule>
What’s happening here is you are telling the access file to cache resources such as static jpg and png images for 1 week so they are available from memory.
Also remember to set an ExpiresDefault “access 1 day” to ensure your document is fetched from the cache rather than the source until the time has passed EG 1 day, after that, the cached copy is found to be “expired” and “invalid”, and a new copy must be obtained from the source. This is a good idea especially if you do change things then users are not going to see out of date resources held in the cache. We have some useful explanations further down in the “what we did” section
Problem 4. Minify CSS, Minify Javascript & Minify HTML
With Minify CSS, Minify HTML & Minify Javascript they are all similar concepts in what we need to do here, basically we need to strip out any unnecessary white spacing and comments and compact our code to a minified state, this will ensure faster loading of the resources in question.
You may not want to minify half of your files because you may want to re-code some of your HTML, Javascript or CSS and it can be frustrating to try and read & understand them once minified. If you are going to do this a good measure is to keep a backed up copy of the files in a none-minified state for readability. If you know they are pretty much never going to change then minifying your files can be a great idea
There are plenty of tools out there and you might have a preferred one but resources I have found useful are as follows
https://www.willpeavy.com/minifier/ (for your HTML)
Problem 5. Enable Compression
By enabling compression of your files will allow you to load these using less bandwidth which can save a great deal of time.
Let’s not get confused between bandwidth and latency, think of bandwidth as a pipe and your data travelling along that pipe, think of latency as the length of the pipe (fixed length) so no matter how much bandwidth you have it is still going to be the same distance your data has to travel to and from each end of the pipe. All we are doing as allowing more data to travel from point to point by saving on bandwidth thus increasing loading times of your resources.
This takes us back to the htaccess file in apache where you can enable this with some commands like so
<ifModule mod_gzip.c>
mod_gzip_on Yes
mod_gzip_dechunk Yes
mod_gzip_item_include file .(html?|txt|css|js|php|pl)$
mod_gzip_item_include handler ^cgi-script$
mod_gzip_item_include mime ^text/.*
mod_gzip_item_include mime ^application/x-javascript.*
mod_gzip_item_exclude mime ^image/.*
mod_gzip_item_exclude rspheader ^Content-Encoding:.*gzip.*
</ifModule>
Once again remember to take backups and test, test, test
I will point you to some more resources below at the end of the article that go more in depth into these discussions to give you a better understanding.
Problem 6. Avoid landing page redirects
Sometime you need to avoid redirects from one url to another to cut out any additional wait time for your users. For whatever reason there will be additional round trip latency time with additional redirects.
For instance you may have a resource file sitting at destination A and you might be calling it from destination B(http) destination C(https) and maybe even D (a none www version of your domain). What we have here is 3 different starting points so both B,C & D should redirect directly to A. B C & D should not redirect to each other. Again this could turn out to be an in depth article on resolving problems like this so I will point you to another great resource that I would highly recommend if you want to learn more which is gtmetrix.com
What we did
With our own website we found some real problems such as the external calls to google analytics and external google fonts causing our webpage speed to a run a whole lot slower. We also found that we were making unnecessary calls for extra google fonts we did not need. So here are some neat trick on what we did to eliminate those problems.
Resolving the Google Fonts issue
1: Our external calls to google fonts looked like this
href=”//fonts.googleapis.com/css?family=Open+Sans:300italic,400italic,600italic,700italic,800italic,400,300,600,700,800
and this
href=”//fonts.googleapis.com/css?family= Oswald:400,300,700
This was always an issue during our page speed testing so we thought what on earth can we do to speed these two calls to google fonts, here’s what we found out
A: Firstly we found that we could actually combine these two resources together using the pipe command
<link href=”//fonts.googleapis.com/css?family=Open+Sans:300italic,400italic,600italic,700italic,800italic,400,300,600,700,800|Oswald:400,300,700″ rel=”stylesheet” type=”text/css”>
Great now we only need to make 1 call
B: We slowly went through all these fonts to see if we actually needed them all and hey presto we didn’t we found we actually only needed
<link href=”//fonts.googleapis.com/css?family=Open+Sans:300italic,400|Oswald:400″ rel=”stylesheet” type=”text/css”>
Even better now we have only one external call to google fonts and we have a lot less fonts to call. What else can we do we asked ourselves so we broke it down further, next step lets paste the url call into the browser and see how big the file is and see what it is doing.
href=”//fonts.googleapis.com/css?family=Open+Sans:300italic,400|Oswald:400
WOW it has presented us with a very small css file which is actually making more calls to further resources. OK we asked ourselves once more, can we do anything else? The answer is YES we can, we can download this css file and save it to our web server and actually we can add this to the bottom of our bootstrap.css file and call with just the one file along with the rest of our resources.
So what have we solved here?
A: 2 calls too many google external fonts rolled into one.
B: Stripped out the unnecessary fonts and called less resources from google
C: Downloaded the css file it calls and merged this into our main css file
D: Now we have only 1 main css file which we can then look into further for the above and below content to serve the resources accordingly.
Resolving the Google Analytics issue
Right lets now deal with google analytics, have you seen the size of this file? surely there is something we can do. Again the answer is yes. During our page speed tests and when our webpage loads we are making an external call to google analytics which once again is hindering our page speed. What we did here was amend the following.
We had this in our code
<script>
(function(i,s,o,g,r,a,m){i[\’GoogleAnalyticsObject\’]=r;i[r]=i[r]||function(){
(i[r].q=i[r].q||[]).push(arguments)},i[r].l=1*new Date();a=s.createElement(o),m=s.getElementsByTagName(o)[0];a.async=1;a.src=g;m.parentNode.insertBefore(a,m)})(window,document,\’script\’,\’//www.google.com/analytics.js\’,\’ga\’);ga(\’create\’, \’UA-48465538-1\’, \’compareandchoose.com.au\’);
ga(\’send\’, \’pageview\’);
</script>
You will see here that our call to grab and load the analytics.js script is https://www.google-analytics.com/analytics.js (mostly known as ga.js)
We did further research and found that we could setup a cron job and load the analytics.js onto our web server on a nightly basis. That allows us to now call it from the browser cache and make use of the leverage browser caching control. By just changing one following commands in your analytics code will enable you to call this directly from your webserver
www.YOURDOMAIN.com/analytics.js
Rather than go in to a real in depth article on how to do this step by step I am going to point you to a fantastic resource which we actually took reference from, which is diy wp blog. It will explain in depth how to do this correctly.
We hope this article can assist you in conquering your page speed goals, please feel free to share with your colleagues and friends, below are some useful tools that will get you well on your way in learning more around the complex issue you may be facing, and as always if you need an any help feel free to contact us.
Helpful resources
Patrick Sexton’s feed the bot
tinypng.com (for compressing your images, up to 20 at a time)
compressor.io (for good compression)
diy wp blog (for eliminating external calls to google analytics)
https://www.willpeavy.com/minifier/ (for your HTML)
Google page speed plug in for chrome (Now Deprecated)
I am the director of Compare and Choose’s travel comparison website, having many years experience I head up & overlook all the SEO in the organic and social space. A skilled developer with in depth knowledge in structured mark-up, page speed issues all things SEO and of course an interest in travel. If you need page speed services, I can recommend SEO Tweaks.
Image citations go out to: Pixabay